

Florida and Arizona Confirmed the True Final Election Battlegrounds, Newly Released AI Research Shows
![]()
Two days before election day, we are releasing new data we gathered by applying artificial intelligence to analyze all of the 25,000 political advertisement orders submitted in real time to the FCC. This data, which it would take about one year for a single person to collect manually, uncovers new key insights into the presidential campaign endgame.
The freshly opened treasure trove of data about campaign spending paints an in-depth picture of the strategies to confirm or upset projected poll results, and how the competing campaigns value what ultimately counts – the electoral votes in each swing state.
Let’s explore if for once, artificial intelligence and big data can inform the 2020 election not just from the side of the candidates, but from the side of the public too.
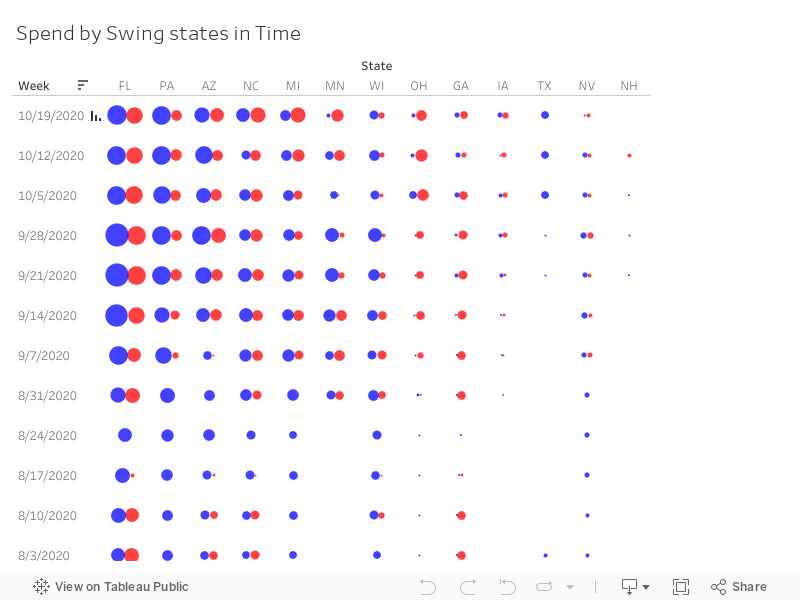
The True Swing States of This Presidential Election
The contest for Florida: While Pennsylvania and North Carolina might be the media favorite October swing states, the campaign analysts were of a different mind. Florida unequivocally leads the spending chart at combined $145M for TV advertisement, totalling almost twice the TV spend of Pennsylvania. This focus makes sense considering that with 28 electoral votes it’s the second biggest swing state, and the race is extremely close with fivethirtyeight reporting just a D+2% margin in polls in this very diverse state.


An unlikely contender: Arizona (polls D+3.2%) emerges among the most contended swing states with election spending of $62M (just 20% less than in Pennsylvania) on TV advertising and narrowly pulls ahead of North Carolina in the totals. The explanation may lie in a complex probability game – if Mr. Biden gets the support of all the large-margin swing states (NH, MI, MN, WI and NV all projected above D+5%), simply winning either Pennsylvania or Arizona (plus Omaha) is sufficient to push him over the fabled 270 electoral votes watermark.
Which states are the real 2020 swing states? Michigan, Wisconsin and Minnesota definitely all see major influx of campaign money. However, with Ohio, Georgia, Nevada and Iowa, the budget of both teams diminishes quickly. And most meaningfully, Texas got mere $5M in combined TV funding despite offering 38 electoral votes up to grabs. The juicy part? All that Texas broadcast came only in the last three weeks and just from the blue party. But given the budget, we are left wondering if that’s a real attempt to steal Texas from the red or a mere token effort with polls showing R+1% in the state.
* See a bigger version
The Hunt for Red October: The start of October has clearly upset the advertising dynamics just before entering the final stretch. Specifically, we observe Mr. Trump engaging in major counter-offensives in North Carolina, Michigan and Minnesota. The red team charged from being the smaller player in these states to clearly outspending their opponent through October. While North Carolina is shaping up as a close call, Michigan and Minnesota intrigue us as major republican funding destinations with the polls predicting D+8.9% in both.
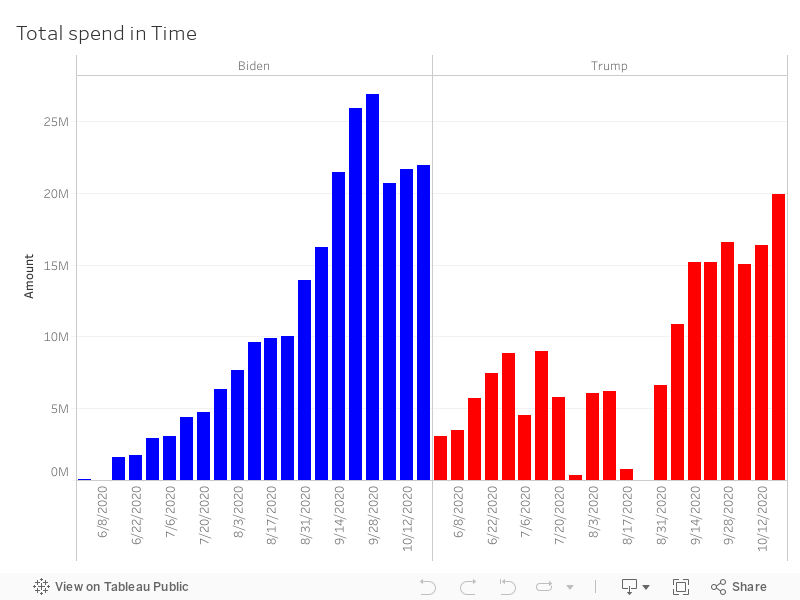
The blue campaign spends more, but where? The total amount spent on TV advertising paints an uncompromising picture – the Biden/Harris campaign is estimated at $331M based on the FCC submissions, while the Trump/Pence team is estimated to have spent significantly less at $239M. However, breaking this down by states gives this nuance and shows a more balanced scene. The Democrats strategy in October is narrower – they challenge the Republicans by massively outspending them in five states, while the Republicans cast a wider net and trump them in another six. (We don’t dare to call the trends in Nevada and New Hampshire either way.)
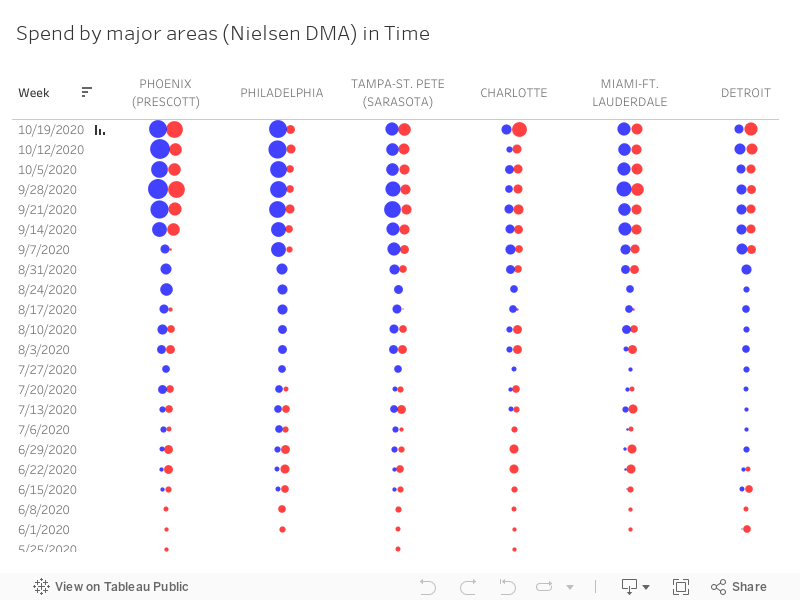
And the winner of the most expensive single advertising booking we registered in 2020: Contracted four months ahead of flight, it runs from Oct 27 to Nov 3 in Tampa/St. Pete, Florida, and Donald Trump’s campaign pays $884,250.00 for it. Here is the original FCC filing.
Meanwhile, Joe Biden’s biggest ticket of $468,275.00 went to an ABC affiliate in Philadelphia and aired in the second week of October.
Long-term Lessons We Can Learn From Campaign Spendings
Did Bill Stepien take all of 1.5 months to get up to speed as Trump’s campaign manager? While Biden’s spending for TV spots has been steadily increasing week by week until late September, Trump’s campaign does not follow a similar growth curve for long. We can see a sudden flat line starting July 15th when the previous campaign manager was replaced, and the campaign only picks back up at the beginning of September.
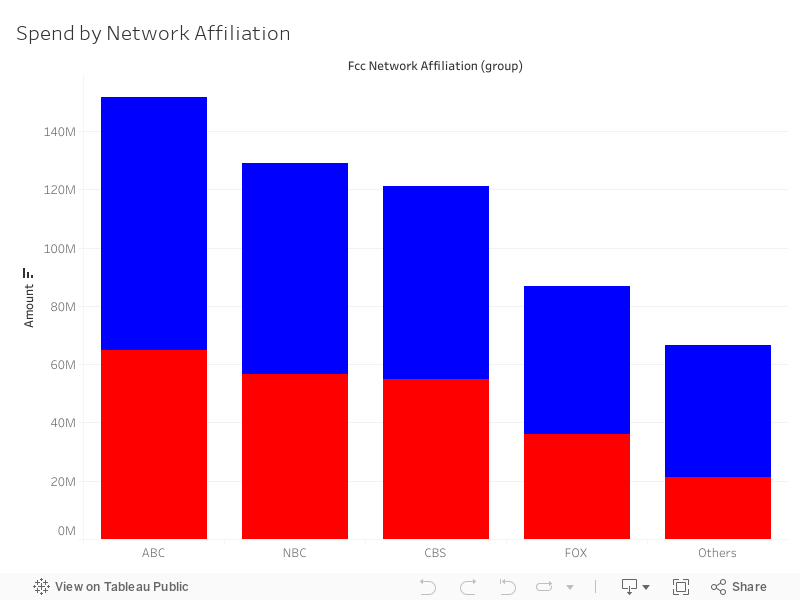
Political favoritism in the media? The FCC data can also be tracked to affiliated networks, and the natural next question is whether different TV networks see different ratios of bookings by the two campaigns. Currently, we don’t see a pattern, but feel this is something to watch and analyze further.
And ultimately, does money really buy votes after all? The data can be correlated with the polls and actual results to see if the campaigns correctly assessed the value of an electoral vote in each state. We are especially excited to explore how much early vs. late campaign spending influences the election results. Of course, we need to wait for the results yet.
The Public Access Difference
The FCC has done an incredible job of collecting political ad information from the networks and making that data available in raw format to the public in near real time – the issue is simply that the key data is not machine readable but locked in the PDFs submitted by networks. While research on presidential campaign spending (like Advertising Analytics or Kantar/CMEG estimates) already exists, these are either just approximations and educated estimates, or are expensive to access because they are based on manually sifting through almost 25,000 documents submitted by networks to the FCC.
Thanks to recent AI breakthroughs, we are the first to automatically extract key data like the advertiser, the callsign and city, flight times and total amount from most of the almost 25,000 political insertion orders submitted by media networks to the FCC and make that entire dataset freely available to the public. Importantly, the full released dataset goes all the way to the individual order level granularity. This data can now be opened to the public without any charge because Rossum’s AI engine captures the data at a fraction of the cost of a team of human analysts. While we just shared some basic analysis, we expect external data journalists to identify many more patterns or unique discrepancies… or simply take a closer look at the literally free advertising of the 500 orders priced at $0.
But this level of access can be even more important for state and local elections, which get no research coverage at all right now – it is simply too pricey to process invoices from county sheriff campaigns. But if a sheriff or a judge spends over a $1M on a campaign, that is still a matter of great public interest. All this data is hidden in FCC-submitted orders and AI can extract it just as easily.
Perhaps this level of public interest can ultimately help campaign leaders as well as journalists, not just to maintain a level of fair play, but also to think better about how to run a campaign efficiently. One radical idea to consider is that raising and spending money in a campaign is similar to how modern Direct To Consumer startups are scaling, and many of the same metrics do apply.
This project has been a collaboration of Rossum, the London-based disruptive document AI company, and e.ventures Data, data analytics at the first technology-enabled global venture capital firm.
Methodology note: Numbers across different research sources may not be directly comparable. The Rossum/e.ventures research counts only direct campaign spend on TV, and produces a total amount spent accuracy of 95% for each FCC document. Other research may include other media (TV+radio, or including digital as well) or include spend by other supporting groups as well. Despite absolute amount discrepancies, all sources should paint the same big picture and we expect them to pinpoint patterns and anomalies equally well.
About us
About Rossum
Rossum has the vision to create a world without manual data entry, improving the work life of countless back office workers. Only Rossum offers an end-to-end AI document processing solution that combines the leading cognitive data capture platform with a full suite of integration capabilities that specifically focus on ease of deployment in real back office processes. The company now automates document-based business communication for organizations ranging from accounting software vendors to Fortune 500 enterprises such as Siemens, Molson Coors and EY. Rossum has already saved one billion keystrokes globally.
About e.ventures
Founded in 1999, e.ventures is the first tech-enabled global venture capital firm and invests in consumer and software companies at their inflection points from early to venture growth stage. The firm is headquartered in San Francisco and Berlin with global partners in Beijing, Tokyo, and São Paulo. e.ventures has combined its extensive, truly global network with local experience and insight to partner with over 250 startups globally. Notable US investments include Sonos, Appfolio, AngiesList, TheRealReal, Shipt, Segment.io, NGINX, GoPuff, and Acorns, among many others, and notable European investments include FarFetch, Deposit Solutions, CityDeal/Groupon, Staffbase, Exporo, Blinkist, and Asana Rebel